 Dansday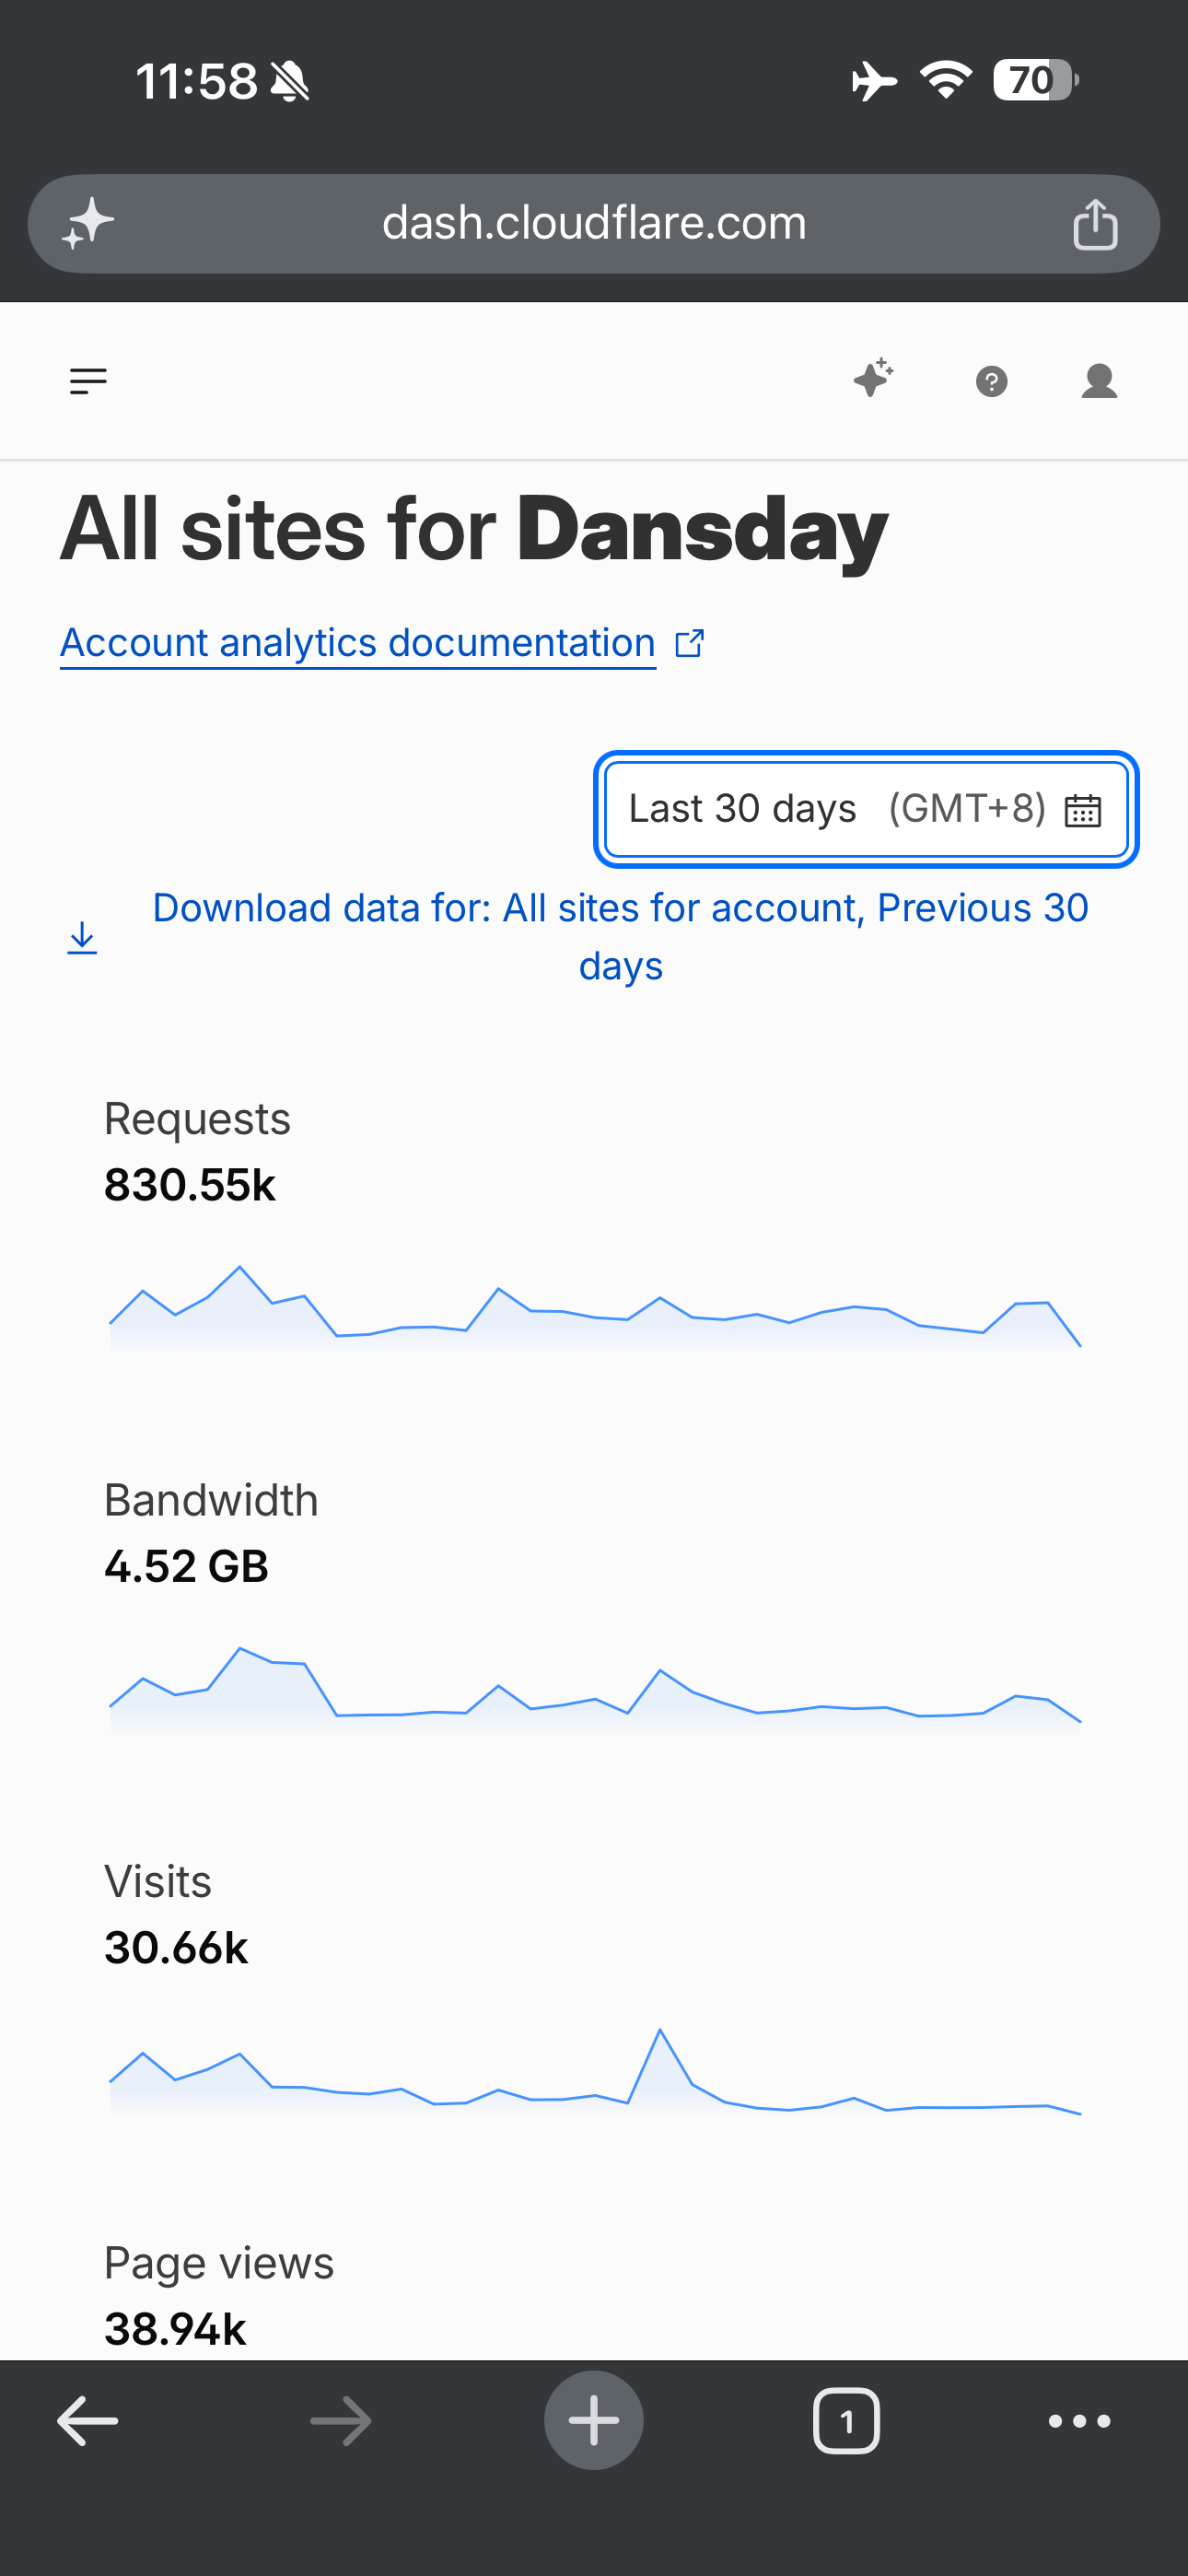
I was not planning to look at it. I opened the Cloudflare dashboard for something else, saw the last thirty days sitting there, and ended up staring at it longer than I needed to. 830 thousand requests. 30 thousand visits. 38 thousand page views. 4.52 GB of bandwidth.
This is a site I host myself. I set up the DNS, the cache rules, the SSL, the redirects, all of it. So when I look at that bandwidth number sitting next to the request count, I know exactly what it is telling me. 4.52 GB for 830 thousand requests means almost nothing is reaching my server. Cloudflare is answering it at the edge and my origin is doing very little. That was the whole point of the setup, and it is good to see it actually working.
The graph itself is flat, and I like that more than I expected to. No spike, no collapse. One small bump in the middle of the month and then straight again. Flat means nothing broke. It means my deploys went out and nobody noticed, which is the best thing that can happen to a site nobody is paying me to run.
I know most of those requests are not people. Bots, crawlers, scanners, whatever crawls the internet at three in the morning. The gap between 830 thousand requests and 30 thousand visits is most of that story and I am not going to pretend otherwise.
But thirty thousand visits is still thirty thousand. This is a site where I write about the things I build, and a year ago I would not have guessed that many people would pass through it in a month.
The thing I keep coming back to is that none of it depends on the infrastructure any more. The stack is fine. The uptime is fine. The only thing that moves these numbers now is whether I sit down and write, and that is the part I am worst at. Servers are easy for me. Finishing a post is not.
Still. A good month. Back to work.