 Dansday
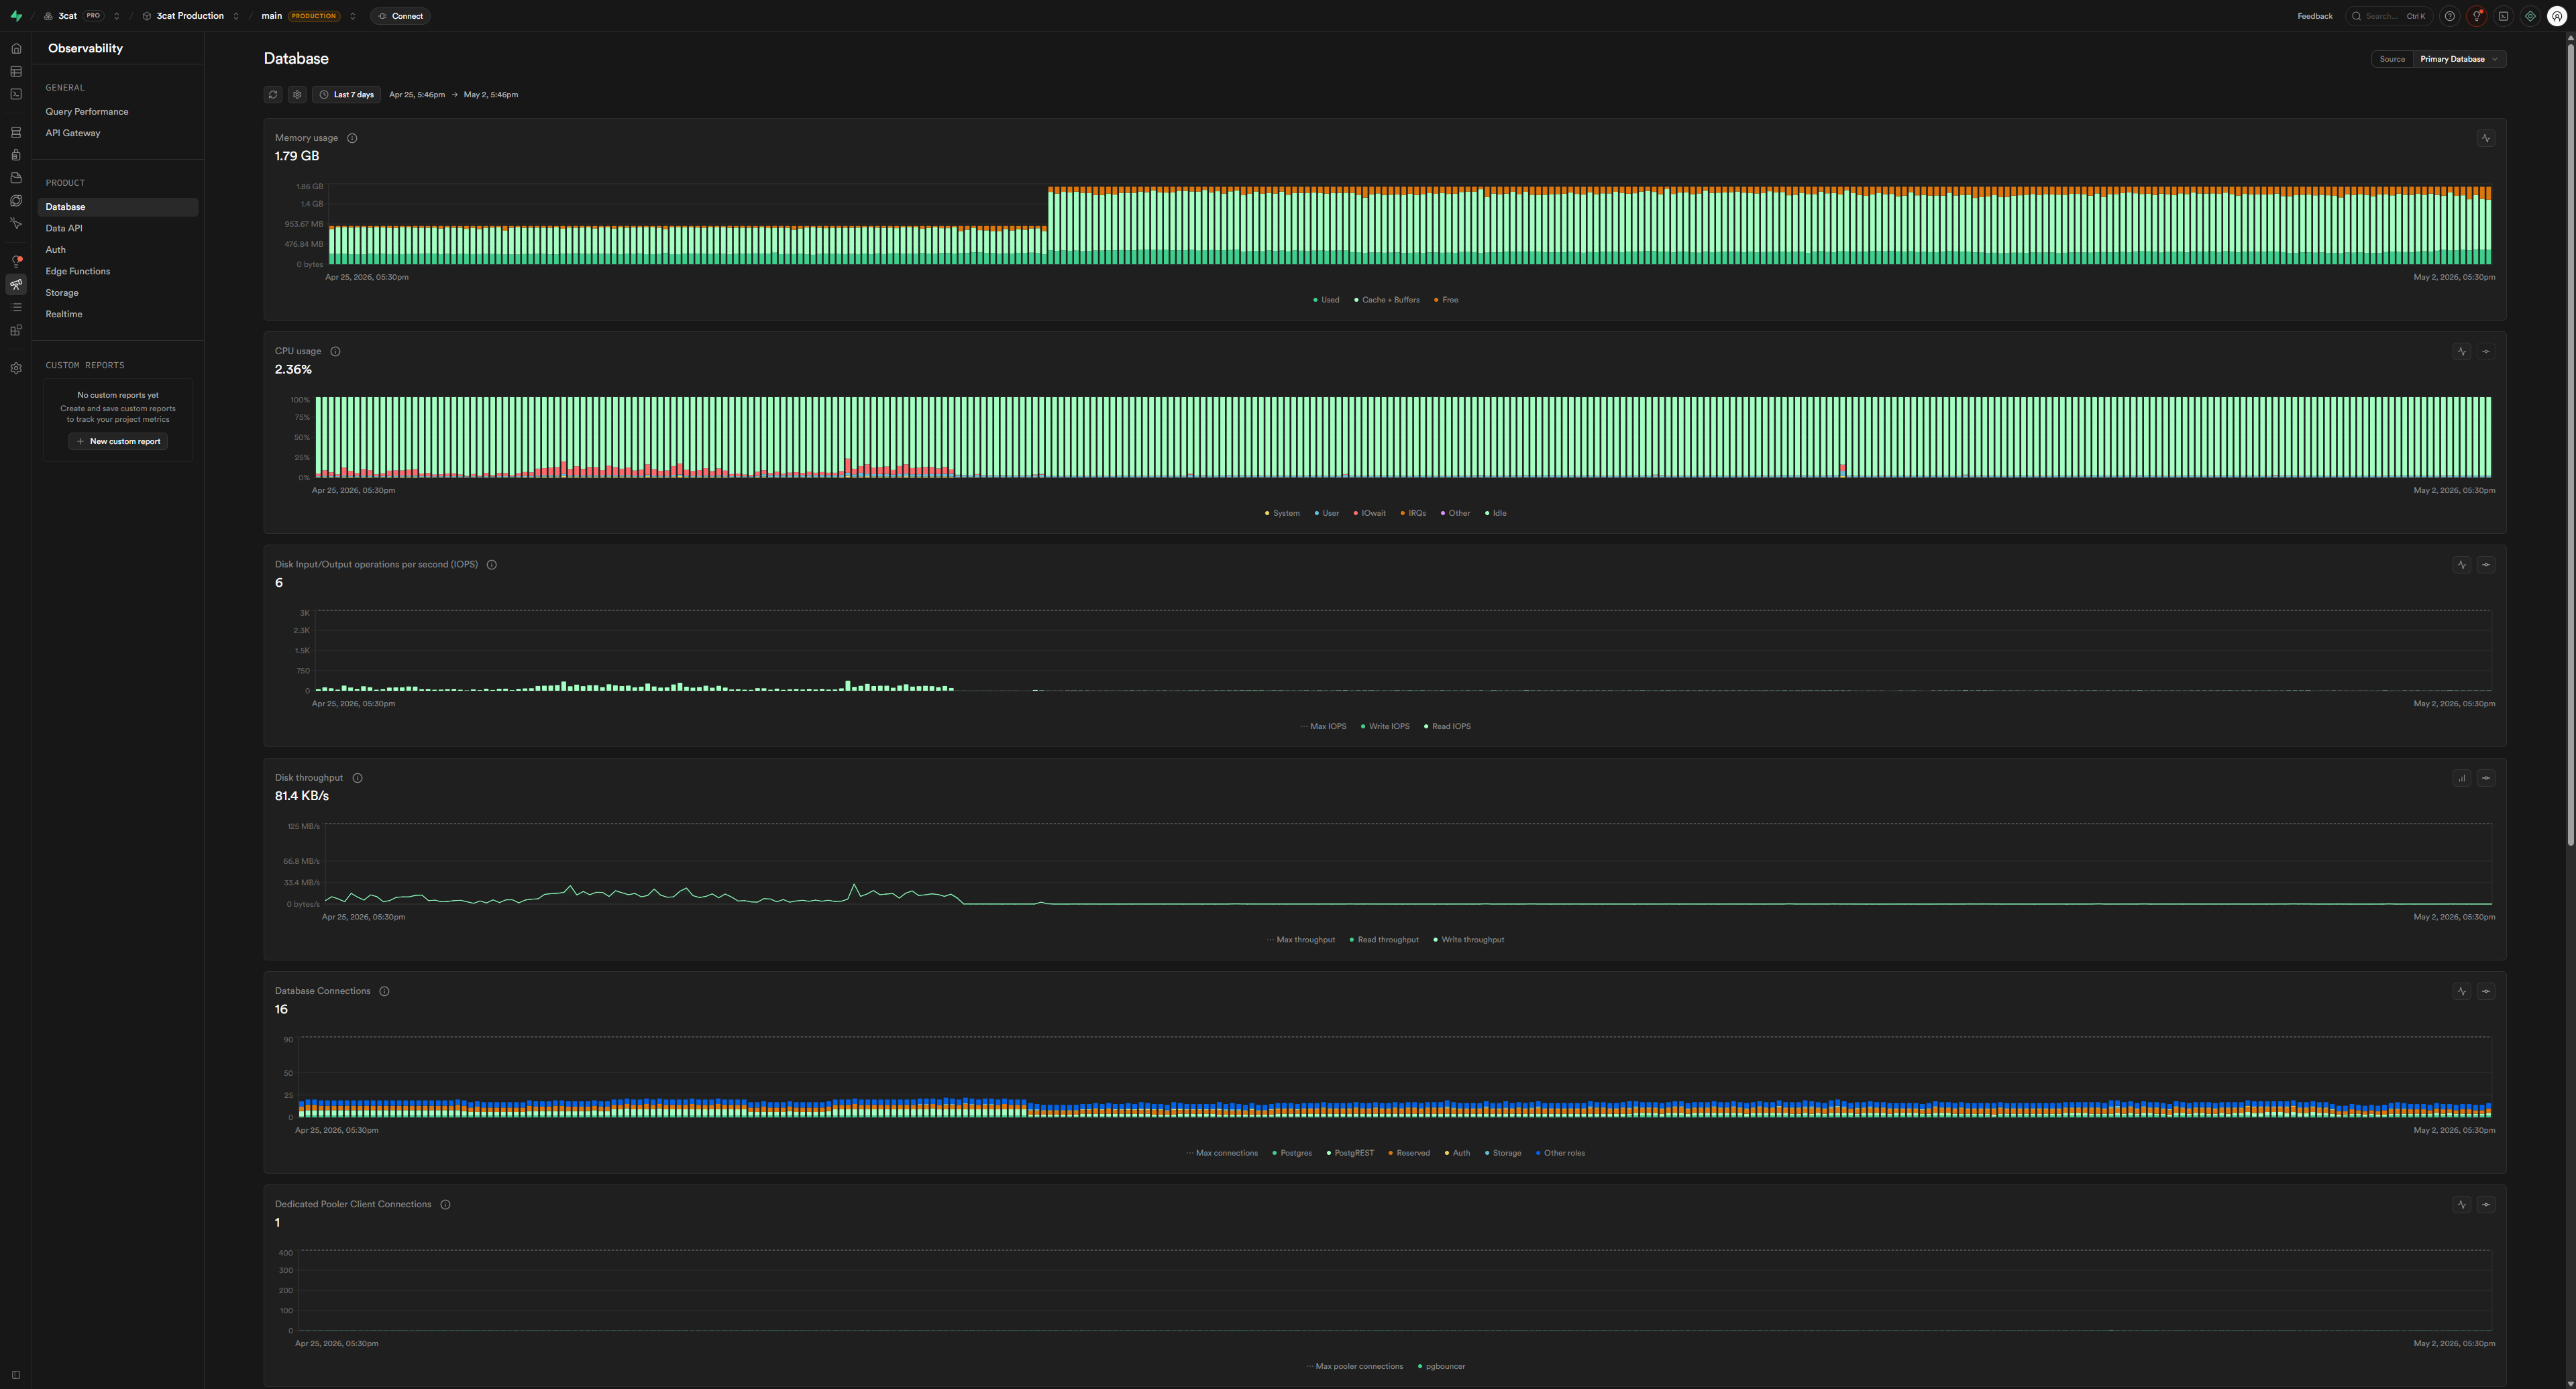
3cat database, a t4g Micro instance on Supabase, started to fall over. There were no recent deployments, no infrastructure changes, just intermittent periods where the app would become completely unresponsive before mysteriously recovering. It felt random and frustrating.
The first and most obvious suspect was the instance size. A Micro tier is, well, micro. It has limited resources, and the easy fix seemed to be just throwing money at the problem by upgrading. But before increasing my monthly bill, I decided to do a proper deep dive to make sure I wasn't just masking a deeper issue.
Understanding the Disk I/O Budget
The Supabase t4g Micro instance has a specific, and crucial, limitation related to its disk performance. It operates on a credit-based system for I/O operations.
It gets a baseline I/O bandwidth of about 10.9 MB/s, which isn't a lot for a database-intensive application. However, it can burst up to 260 MB/s, which is a massive increase. The catch is that you only get to use this burst performance for a total of 30 minutes per day. Once that budget is spent, the disk throughput is throttled back down to the baseline for the rest of the day. For a database, hitting that throttle is effectively a lights-out event.
A quick look at my Supabase dashboard confirmed my fears. On April 21, 2026, I saw that the disk I/O burst budget had been 56% consumed in a single, massive spike. That's about 17 minutes of my daily budget, gone in an instant. The metrics showed disk throughput hitting 98.5 MB/s with 1,355 IOPS. Digging a little deeper, the vast majority of this was read operations: 1,350 read IOPS versus just 5 write IOPS.
Finding the Smoking Gun
When I see disproportionate read activity, my first stop is always `pg_stat_statements`. It's a PostgreSQL extension that tracks execution statistics for every query that runs, making it invaluable for finding resource hogs.
I ran a query to find the top offenders, ordered by the number of data blocks read from disk:
The results were immediate and undeniable. One query stood out, and not in a good way.
A simple `SELECT * FROM respond_io_messages WHERE c
For such a simple query, a number that high can only mean one thing: a full table scan. Every single time this query ran, Postgres was reading the entire `respond_io_messages` table from disk, row by row, to find the matching records.
Confirming with EXPLAIN ANALYZE
To be absolutely sure, I ran an `EXPLAIN ANALYZE` on the query. The output confirmed the diagnosis in black and white: `Seq Scan on respond_io_messages`. The execution time for a single query returning just 100 rows was a staggering 4,780 milliseconds. Postgres had no index to help it find the data efficiently, so it was taking the long way around every single time.
The Five-Minute Fix
The solution was as simple as the problem was severe. The table was missing an index on the `contact_id` column.
I added the necessary index:
I also noticed a few other queries that filtered by `contact_id` but sorted the results by `created_at` or `respond_message_id`. To optimize those as well, I added two composite indexes to cover those specific access patterns:
With the indexes in place, I ran the `EXPLAIN ANALYZE` again. The plan had changed from a `Seq Scan` to an `Index Scan`. The execution time dropped from 4,780 ms to just 0.105 ms. That’s a 45,000x performance improvement.
After letting the application run for a bit, the new statistics told the full story. The `shared_blks_read` for that query dropped from 3.2 billion to just 31. The disk I/O pressure vanished, the burst budget stopped getting drained, and the intermittent downtime ceased completely.
How to Proactively Find Missing Indexes
This incident taught me the importance of proactively hunting for these kinds of problems. A query that works fine on a small table can become a production-killer as the table grows. I now regularly run a couple of queries to keep an eye on things.
- Find tables with high sequential scan counts.
This query identifies tables that are frequently being read from top to bottom. A high `seq_scan` count combined with a low `idx_scan` count is a major red flag.
- Find queries with high disk block reads.
This is the same query I used to find the original problem. Any query with a `shared_blks_read` that seems disproportionately high for what it does is worth investigating.
Outcome
In the end, I cancelled the plan to upgrade the instance. The server was never the problem; my query was. A few `CREATE INDEX` statements solved an issue that had been causing headaches for months, saved me money on an unnecessary upgrade, and made the application significantly faster. The diagnosis took a couple of hours, but the fix itself took less than five minutes. It was a powerful reminder that sometimes the most impactful solutions aren't about bigger hardware, but smarter queries.